The Stats are in
.jpg?w=128&h=128)
Matt & Gena Lamontagne
Doing what’s best for their clients and community is what drives the award-winning Matt and Gena Team...
Doing what’s best for their clients and community is what drives the award-winning Matt and Gena Team...
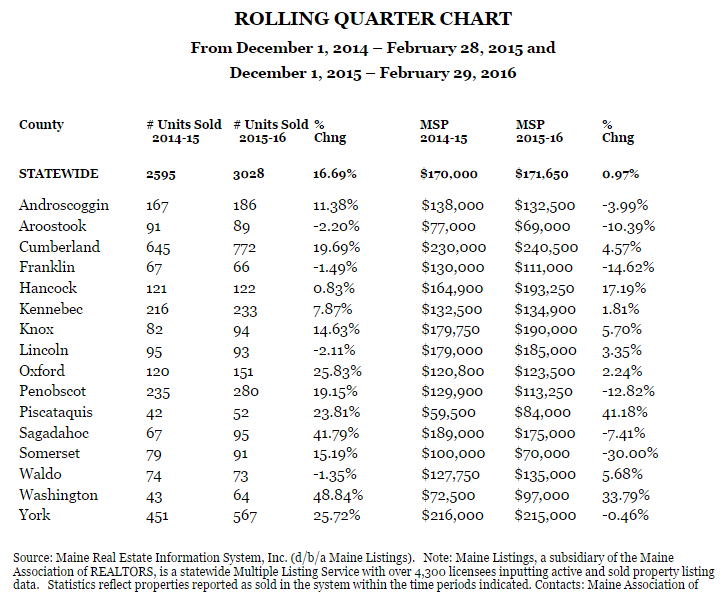
Spring is finally here! Sales up and values slightly down in February. Whether you are looking to buy or sell, or just want to follow your own market, this information will be helpful for you.
See the full report here and contact us for instant access to real time, live market reports for your area:
FOR IMMEDIATE RELEASE CONTACTS: LISTED BELOW
MAINE HOME SALES UP 21.72 PERCENT IN FEBRUARY
AUGUSTA (March 21, 2016)—Sales of single-family existing homes in Maine continued their upward climb during the month of February. Maine Listings reported a 21.72 percent jump in sales over the past 12 months. The median sales price (MSP) of $160,000 reflects a slight price decline of 4.42 percent. The MSP indicates that half of the homes were sold for more and half sold for less. Nationally, sales of single-family existing home sales increased 2.0 percent, and the national MSP rose 4.3 percent to $212,300 in February. According to the National Association of Realtors, the regional Northeast experienced a 5.0 percent sales jump in the past year, while the regional MSP eased 0.8 percent to $239,700. Ed Gardner, 2016 President of the Maine Association of Realtors, says, “If you're thinking about buying this spring, consult with a REALTOR® who has unique local market knowledge and insights that can't be replicated by online searching.” Gardner, Broker/Owner of Ocean Gate Realty LLC, added, “Let your REALTOR® help you make a smart decision and be your resource through the home buying process. With a REALTOR® by your side, you will be empowered to buy your greatest investment, with knowledge and competence.” Below are two charts showing statistics for Maine and its 16 counties. The first chart lists statistics for the month of February only, statewide. The second chart compares the number of existing, single-family homes sold (units) and volume (MSP) during the rolling quarter of December (’14 and ’15), January (’15 and ’16) and February (’15 and ’16). (Continued)