November 2018 Falmouth Market Update
Falmouth Real Estate Market Trend
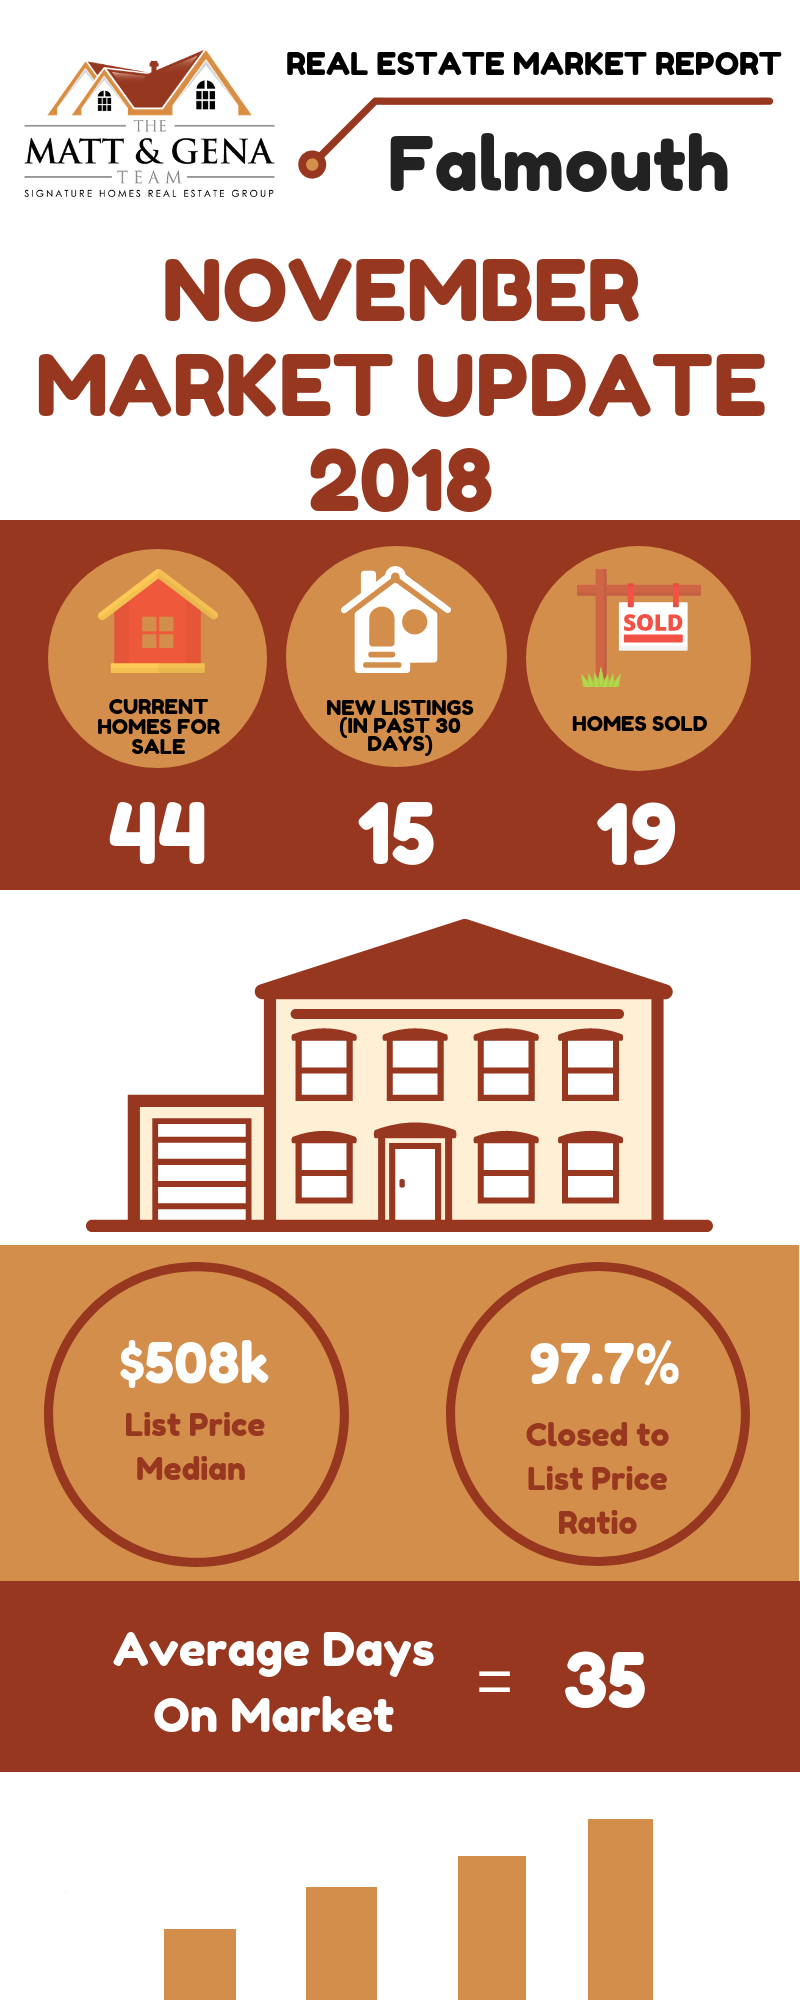
The housing market is complicated. Our goal is to make it less so. Knowing the most important data such as the number of homes sold, average sales prices and days on the market, will better prepare you to buy or sell a home. Our market report is easy to understand and showcases everything that you need to know about local real estate trends. Watch as Matt breaks it down for you!
November - Falmouth, ME
💰Median List Price = $508k ⬆ from $479k in Oct
🏡New Listings = 15 ⬇ from 16 in Oct
🔑Homes Sold = 19 ⬇ from 22 in Oct
⏱Average Days on Market = 35 ⬇ from 39 in Oct
👌Closed Price to List Price Ratio = 97.7% ⬇ from 100% in Oct
October 2018
✅Average Home Price = $479,000
✅List Price per Sqft at all time high (data from 2013 to date) = $248 (2013-$193, 2014-$205, 2015-$221, 2016-$198, 2017-$220)
✅Sale Price / List Price Ratio at all time high (date from 2013 to date) = 100%
Wonder what these numbers mean for you?
We can translate!